This report allows you to compare sales made on two separate days. By default, when you enter a Compare Date it will auto-fill the Compare To Date field with the date for the same day of the week last year.
For example, entering 1/1/2018 will yield a Compare To Date of 1/2/2017 as these are both Mondays. You can override the suggested Compare To Date with any date you wish.
To run the report:
- Click Reports > Managements > Sales Comparison. The Sales Comparison Report window will appear.
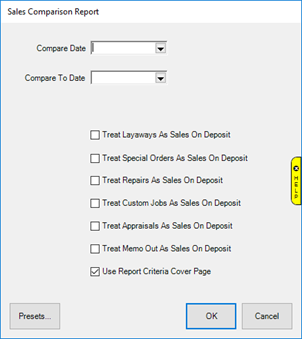
- Specify a date in the Compare Date field.
- Compare To Date will auto-fill with the date for the same day of the week from last year. Override this if you wish.
- Use the checkboxes to indicate whether multi-step transactions should be counted as sales on intake (check the box) or pick up (leave unchecked).
- Click OK to run the report.
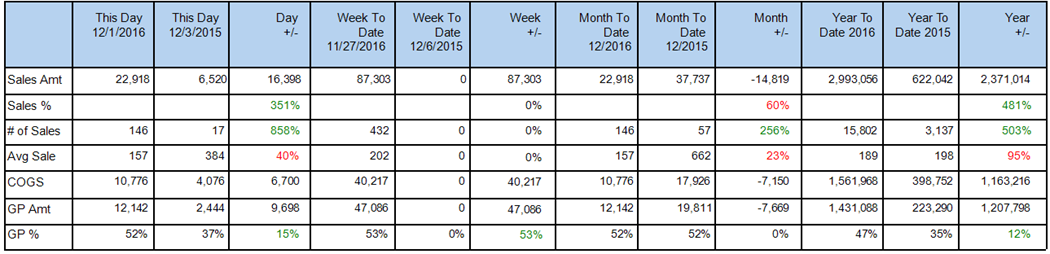
Columns are shown comparing the specific date along with the value or percentage change. It also gives cumulative data for week to date, month to date, and year to date.
Rows include:
|
Sales Amt
|
Total value of sales. Multi-step transactions such as special orders will be included in this figure on deposit only if you checked the corresponding box on Step 4, otherwise only picked up transactions are included.
|
|
Sales %
|
The percentage of change. Green indicates positive change while red indicates negative.
|
|
# of Sales
|
The number of sales transactions.
|
|
Avg Sale
|
The value of the average sale
|
|
COGS
|
The total cost of goods sold.
|
|
GP Amount
|
The gross profit dollars made.
|
|
GP %
|
The gross margin percentage.
|