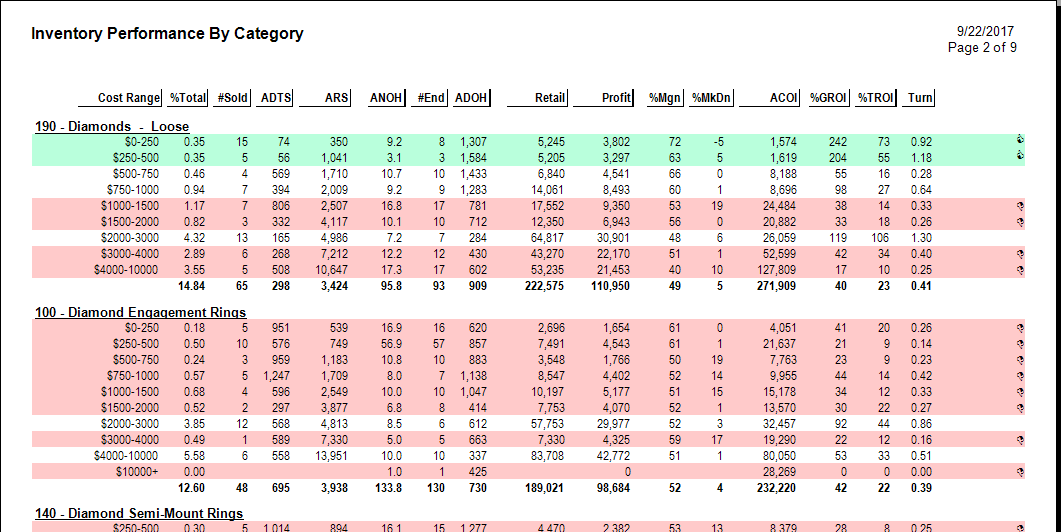
In the tabular version of the report, data fields include:
|
Category or Vendor
|
The category or vendor by which the items are being grouped. This column type will vary depending on the type of report generated.
|
|
Cost Range
|
Each category or vendor can be further broken down by price ranges.
|
|
% Total
|
What percentage of total sales this category or vendor and price point accounts for. It is calculated based on the selling price.
|
|
# Sold
|
The total number of items in that grouping sold.
|
|
ADTS
|
Average days to sell. Of the items sold in this line, the number of days, on average, it took for them to sell.
|
|
ARS
|
Average retail sale.
|
|
ANOH
|
Average number on hand.
|
|
#End
|
Number of items remaining on hand.
|
|
ADOH
|
Average days in stock. Average number of days that unsold items are in inventory.
|
|
Retail
|
The retail price of the items that sold.
|
|
Profit
|
The net profit of the sales from that grouping.
|
|
% Margin
|
The profit margin based on the items that sold.
|
|
% Mkdn
|
The discount that was taken at point of sale marked down from retail.
|
|
ACOI
|
The average value of inventory during the period.
|
|
GROI
|
The gross return on investment for that grouping. If the value is above 150%, it will appear highlighted in green.
|
|
TROI
|
The true return on investment for that grouping. This figure takes into account the full amount of time the item was in stock during the reporting period.
|
|
Turn
|
Number of times that inventory investment turned at cost of goods sold.
|