The Sales by Age report shows amounts of inventory sold and in-stock by length of time in inventory.
The first page contains a graphical representation of the number of items sold by age.

The second page provides the details.
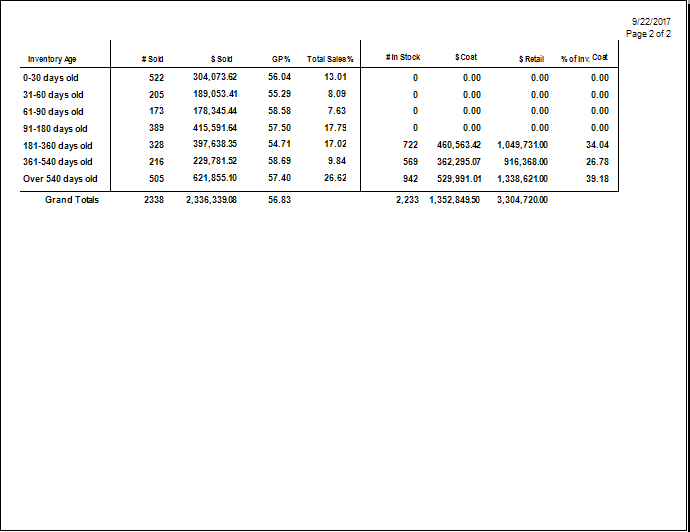
Data fields in the Sales by Age report include:
|
Inventory Age
|
Groupings of data by age.
|
|
# Sold
|
The number of items sold for that age range for the date range run.
|
|
$ Sold
|
The amount in dollars brought in for those items sold.
|
|
GP %
|
The percentage of gross profit yielded by those sales.
|
|
Total Sales %
|
The percentage of the total sales for the date range yielded by those sales.
|
|
# In Stock
|
The number of items in that age range that are in stock.
|
|
$ Cost
|
The total cost of those items that are on hand.
|
|
$ Retail
|
The total retail value of those items that are on hand.
|
|
% of Inv. Cost
|
The percentage of total inventory that this age group makes up in your inventory.
|
By looking at these values, you can see how fast sellers are performing against older inventory and plan new inventory accordingly.
If you double click on the following data values, you’ll get a specific list of items included in the figure to help your further clarify what items are providing the indicated performance.
• # Sold
• $ Sold
• GP %
• Total Sales %
• # On Hand
• $ Cost
• $ Retail
• % of Inv. Cost.