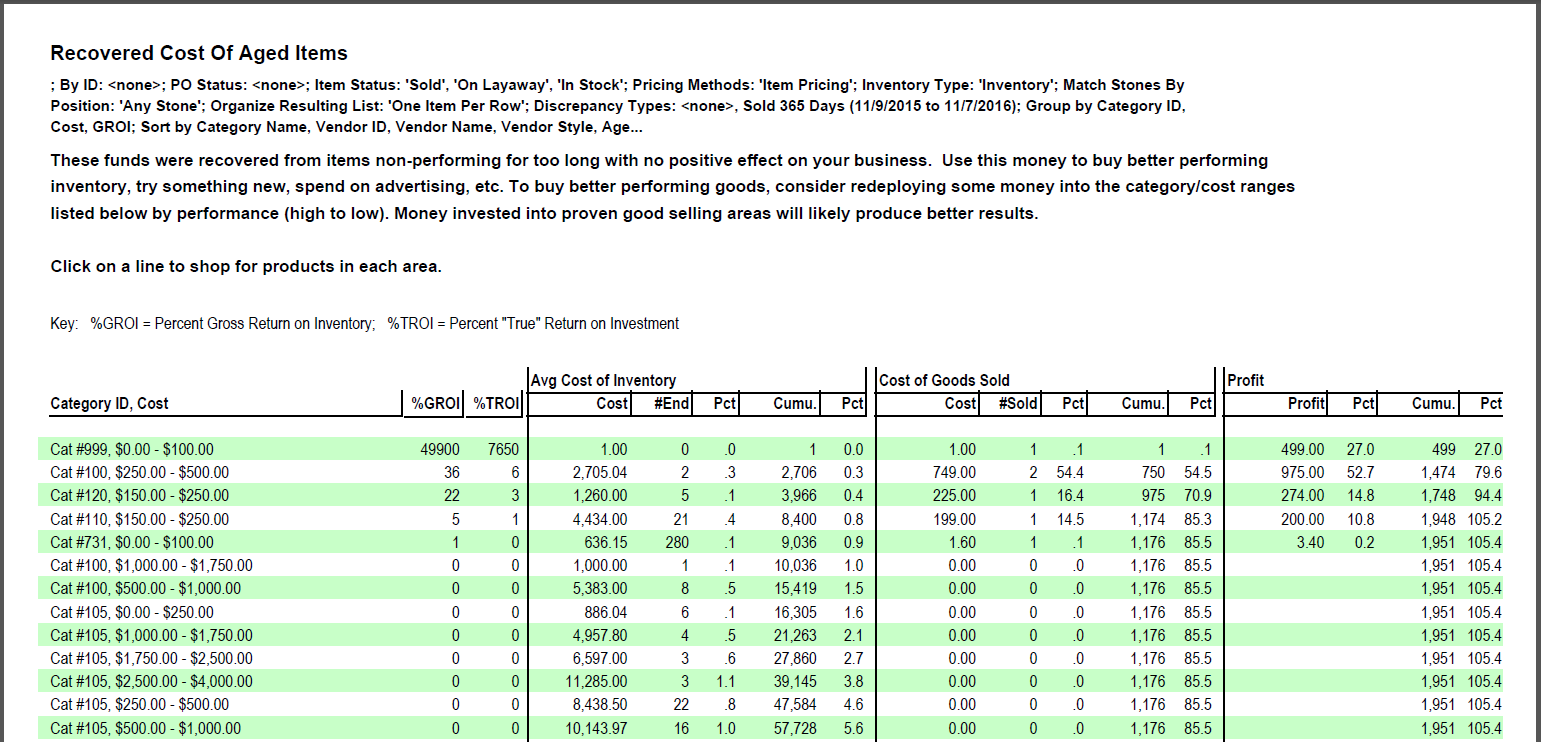
The Recovered Cost of Aged Items report helps you plan the reinvestment of dollars recovered from the sales of aged items. When you put aged items on spiff or sale, you’ll move inventory that has been sitting around for a long time. This is almost like found money that you can now think about investing in good performing categories. It shows a more detailed view of recovered funds than that shown in the Recovered Funds Redeployment Guide.
Data fields in the Recovered Cost of Aged Items report include:
|
Category ID, Cost
|
The category ID and cost range for items listed.
|
|
|
% GROI
|
Percentage gross return on investment for the category and price range.
|
|
% TRIO
|
Percentage true return on investment for the category and price range.
|
|
Avg Cost of Inventory
|
|
|
|
Cost
|
Average cost per item in that group.
|
|
|
|
# End
|
Number of items still in stock at the end of the date range in that group.
|
|
|
|
Pct
|
The percentage of cost of goods in stock that can be attributed to that group.
|
|
|
|
Cumu
|
Running down the report results in that column, this is a cumulative total of the cost of in-stock inventory for groups included in the report.
|
|
|
|
Pct
|
Running down the report results in that a column, this is the cumulative percentage of the cost of in-stock inventory for groups included in the report.
|
|
|
Cost of Goods Sold
|
|
|
|
Cost
|
Total cost of goods sold in that group.
|
|
|
|
# Sold
|
Total quantity sold in that group.
|
|
|
|
Pct
|
The percentage of cost of goods sold that can be attributed to that group.
|
|
|
|
Cumu
|
Running down the report results in that column, this is a cumulative total of the cost of sold inventory for groups included in the report.
|
|
|
|
Pct
|
Running down the report results in that a column, this is the cumulative percentage of the cost of sold inventory for groups included in the report.
|
|
|
Profits
|
|
|
|
Profit
|
Profit made for the group.
|
|
|
|
Pct
|
The percentage of overall profit that can be attributed to those sales.
|
|
|
|
Cumu
|
Running down the report results in that column, this is a cumulative total of the profit from sales of inventory for groups included in the report.
|
|
|
|
Pct
|
Running down the report results in that a column, this is the cumulative percentage of the profit from sales of inventory for groups included in the report.
|