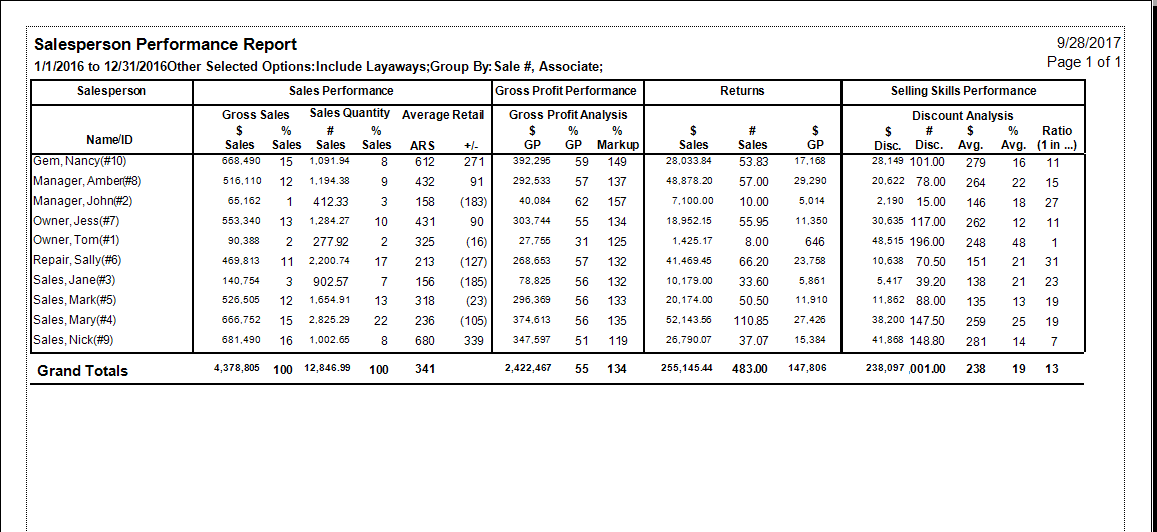
Intended to provide data for associate evaluation and coaching, the Salesperson Performance report provides sales performance broken down in a number of ways, by associate. The report contains inventory only and may include or exclude layaways. Special orders in progress are not counted. They are included when they are picked up.
Data fields in the Salesperson Performance report include:
|
Name
|
The associate’s name.
|
|
Sales Performance
|
Sales performance as broken down below:
|
|
Gross Sales
|
Gross sales are broken down by dollars and percentage of total sales by dollars (i.e., $ = 34,500; % = 12). This would mean that the sales person sold $34,500 at retail that was 12 percent of all sales by dollar amount.
|
|
Sales Quantity
|
Sales quantity is broken down by number of sales and percentage of sales by quantity (i.e., # = 27; % = 8).
|
|
Average Retail
|
Average retail sale (ARS) and +/- which is the difference from the average retail sale amount each salesperson achieved (i.e., $34,500 in sales divided by 27 (the # of sales) = ARS of $1,278). If the average sale for everyone in the store was $555, this sales person would have a +723 in the +/- column indicating their average sale was that much greater than the stores.
|
|
Gross Profit Performance
|
Gross Profit Performance has three columns of information, one identified as dollars ($), another by % of Gross Profit and another as % of Markup. Gross profit is the amount that the store made on the sale above the cost of the item. GP% is the percentage of the total sale that was profit (an important retail metric) and % Markup is the multiplier a retailer would have to use to achieve the profit level on the report. Example: Item costs $48 and sells for $100, the GP would be 52%. To achieve a 52% gross profit margin, items would have to be marked up 109% (48 + (48 x 1.09) = 100).
NOTE: The % Markup is based on the Retail Price of the item, NOT the Sold Price.
|
|
Returns
|
The Returns section has three columns also: $ Sales, # Sales, and $ GP. $ Sales is just that the dollar amount of return sales, # Sales is also just that the number of returns and $ GP is the amount of profit that was lost to returns.
|
|
Selling Skills Performance
|
Selling Skills Performance is intended to measure the effectiveness of the salesperson. The columns are $ Disc, # Disc, $ Avg, % Avg, and Ratio. $ Disc is total discounted dollars, # Disc is the number of sales a discount was applied to, $ Avg is the average dollar discount per discounted sale, and % Avg is the average percentage of discount per discounted sale. Ratio is the number of sales with a discounted price represented as a ratio (i.e., 1 in 5; 1 in 9; 1 in 17, etc.).
|