The Inventory Buying Tools feature consists of six steps and is designed to fulfill two roles:
- Weekly Inventory Orders and Reorders.
- Monthly AIMS Repricing.
These two roles are not dependent on one another and it is entirely possible to use either exclusively. However, the system works best when both are employed side-by-side.
To run Inventory Buying Tools:
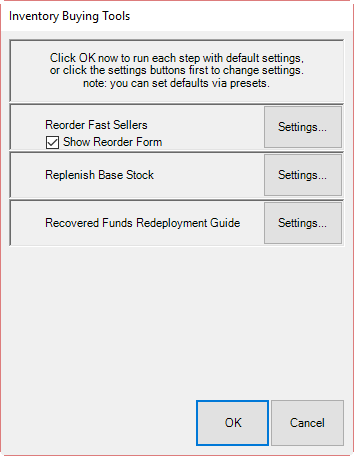
- Select Inventory > Buying Tools.
- Select Weekly Buying Plan. The Weekly Buying Plan includes:
a. Reorder Fast Sellers, which yields the Rapid Reorder Report and Form. This step is used to setup the rapid reorder report and form. From the Settings options, the sale date range should always be Last Week (it will default to this; this step is designed to be run weekly). See the section entitled Rapid Reorder for more information on setting fast seller and reorder criteria.
b. Replenish Base Stock report. This step will setup a report to aid in replenishing current sold inventory. From the Settings options, “current” refers to items that did not sell fast enough to be considered fast sellers, but did not sell slow enough to become aged inventory. The sale date range should always be Last Week (it will default to this; this step is designed to be run weekly).
c. Recovered Funds Redeployment Guide. This step will setup a report to aid in the reinvestment of funds recovered through the sale of old inventory. From Settings, on the Type & Status tab, Date Sold should always be 365 days (it will default to this).
Reorder Fast Sellers
There are two outputs for this step: the Rapid Reorder form and the Rapid Reorder report. Both the report and the form show the same data, albeit in slightly different formats. The report is designed to be viewed and printed for analysis. The form, on the other hand, is designed to be acted upon. It allows styles to be queued for order. See the section entitled Rapid Reorder for more information.
Replenish Base Stock
Base stock refers to inventory that did not sell fast enough to qualify as a fast seller, but did not take long enough to sell to be considered old inventory. It is inventory considered worthy of keeping in stock regularly. In The Edge, an item is considered old once it reaches the second tier of the automatic mark down table. By default, this happens at 540 days.
In this report, sold items are shown based on items sold the past 365 days grouped by category. It is further broken down by price groupings. For each grouping, based on GMROI and the length of time it was held in inventory, The Edge makes a recommendation as to whether you should buy more or hold at the level you have.
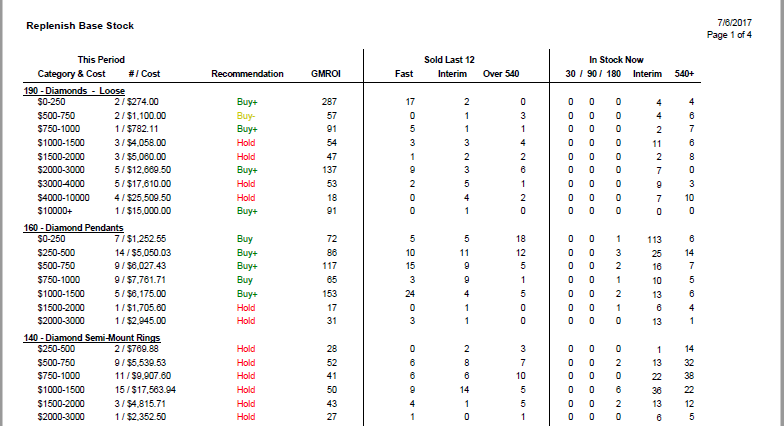
Data fields shown in the Replenish Base Stock report include:
|
Category & Cost
|
The category and cost range being presented.
|
|
# / Cost
|
The cost range within the category being presented.
|
|
Recommendation
|
The Edge’s recommendation as to whether to acquire more items in this category and cost range.
•If Category and Cost GMROI is over 20 percent greater than Total GMROI for that category, then Buy+ (+ indicates that you should buy several).
•If Category and Cost GMROI is up to 20 percent greater than Total GMROI for that category, then Buy.
•If Category and Cost GMROI is less than Total GMROI for that category, but by less than 10 percent, then Buy- (- indicates that you should buy a small number).
•If Category and Cost GMROI is less than Total GMROI for that category by 10 percent or more, then Hold.
|
|
GMROI
|
The gross margin return on investment. The formula used to calculate this is profit divided by the cost of inventory.
|
|
Sold Last 12
|
The quantity of items in the category and cost range sold within the last 12 months. The quantity is broken down by turnover time: fast seller, interim seller, and those that took over 540 days to sell.
|
|
In Stock
|
The quantity of items in the category in stock. This broken down into the quantity that has been on hand for less than 540 days and more than 540 days.
|
In the example above, in category 190, Loose Diamonds in the cost range of $0-$250, the recommendation is buy more because of 19 sold, 17 were fast sellers. We would recommend that you invest more in that area. In category 140, Diamond Semi-Mount Rings in the cost range of $250-$500, of 5 pieces sold, 0 were fast sellers and 2 were interim sellers. We would recommend you hold with the current inventory for the time being.
Selecting values in the following columns will bring up the list containing the items that make up the quantity value for that column:
- # / Cost
- Fast (Sold Last 12)
- Interim (Sold Last 12)
- Over 540 (Sold Last 12)
- Under 540 (In Stock)
- 540+ (In Stock)
Ultimately, this report helps to keep a pulse on where inventory is moving and where money should be invested. The focus is not on exact style replacement, but rather on identifying areas of inventory that perform reliably to suggest where inventory should be maintained. Different styles in that category might give you more variety for your repeat customers who like these types of items.
This report is a more streamlined version of the Replenish Current Inventory report, which was moved to Reports; for more about that report, see the section entitled Replenish Current Inventory Report.
Recovered Funds Redeployment Guide
The output for this step is the Recovered Funds Redeployment Guide. This report suggests categories that, because they performed well based on ROI, would make good areas where money recovered through the sale of old inventory could be reinvested.
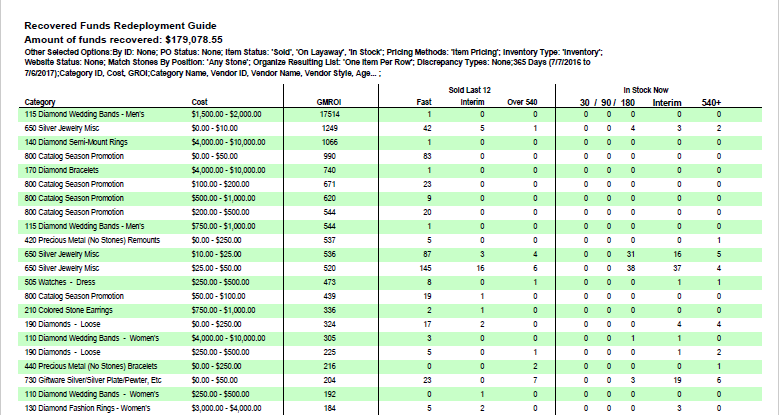
Data fields in the Recovered Funds Redeployment Guide include:
|
Category
|
The category being presented.
|
|
Cost
|
The cost range within the category being presented.
|
|
GMROI
|
The gross margin return on investment. The formula used to calculate this is profit divided by the cost of inventory.
|
|
Sold Last 12
|
The quantity of items in the category and cost range sold within the last 12 months. The quantity is broken down by turnover time: fast seller, interim seller, and those that took over 540 days to sell.
|
|
In Stock Now
|
The quantity of items in the category in stock. This broken down into the quantity that has been on hand for 30/90/180 days plus what is considered Interim and more than 540 days.
|
In the example shown above, category 650, Silver Jewelry Misc in the cost range of $25-$50 had 145 items that were fast sellers. More of this type of seller would be a good investment. Selecting values in the Sold Last 12 columns will bring up the list containing the items that make up the quantity value for that column.
Of course, the report is a suggestion and investment of recovered money is entirely up to you. There are, obviously, investment opportunities outside of the scope of The Edge software.
This is a streamlined version of the Recovered Cost of Aged Items Report, which is found in the Report menu. For more about that report, see the section entitled Recovered Cost of Aged Items Report.